How to Use the Privacy Lock on Form Responses

KPA EHS allows users to adjust the privacy settings of a particular form response to restrict access to it. This could be helpful if there is particularly sensitive material, and it is in the best interest of the company to limit the number of individuals who can see the response.

The privacy lock can be activated when filling out a form, or when editing an existing form response.

Activate the Privacy Lock on a New Response

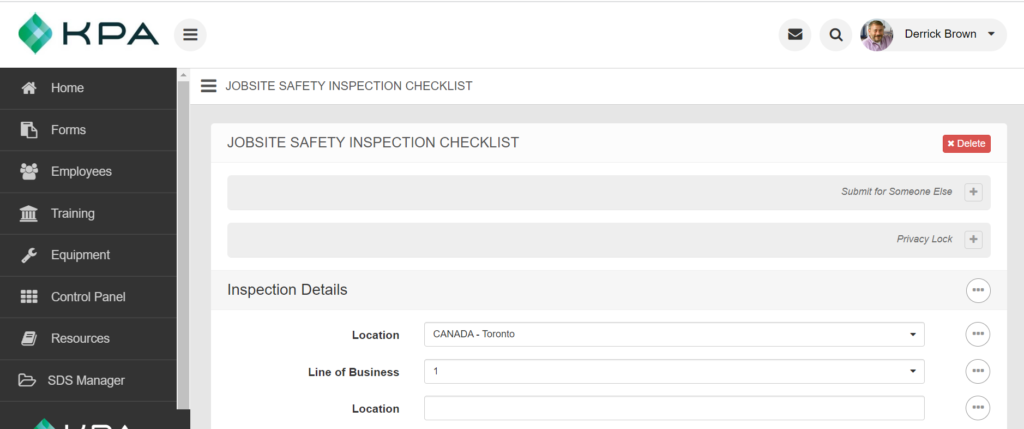
Begin by filling out a form you wish to respond to.
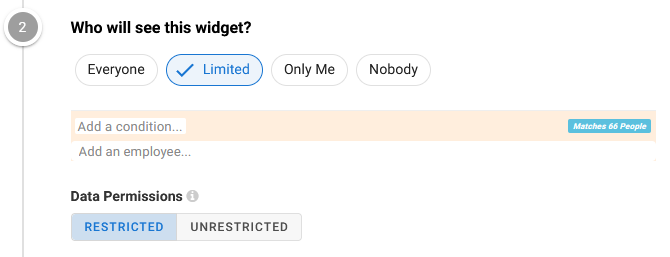
Towards the top of the screen, you will see a section titled “Privacy Lock”:

Select the “+” symbol next to Privacy Lock, and a list of users will appear. Select the user or users you wish to lock the form response to.

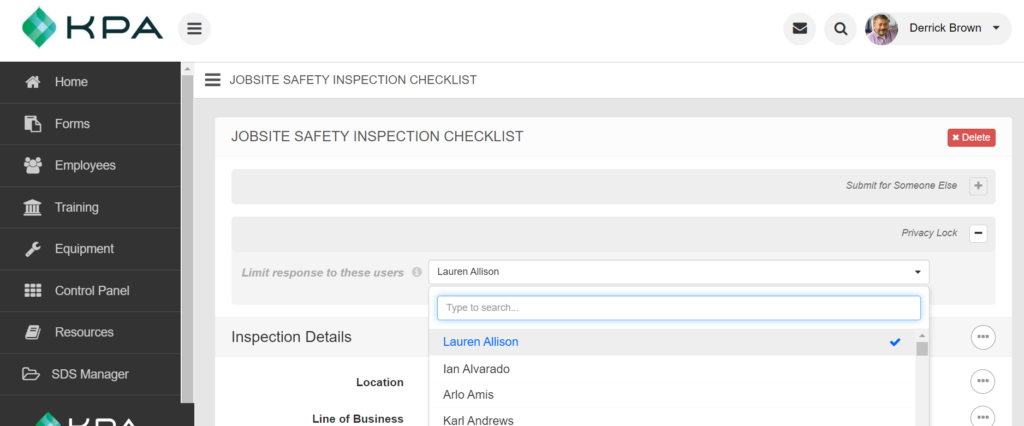
Fill out the rest of the form, as you normally would, and select “Submit”.
This form response will now only be viewable by the user(s) you selected.

Activate the Privacy Lock on an Edited Form Response

Remember, only users with certain Roles & Permissions can edit form responses that have already been submitted. If you don’t see the ability to edit a form, please check with your Admin or a KPA Customer Support team member to make sure you have the proper access level.
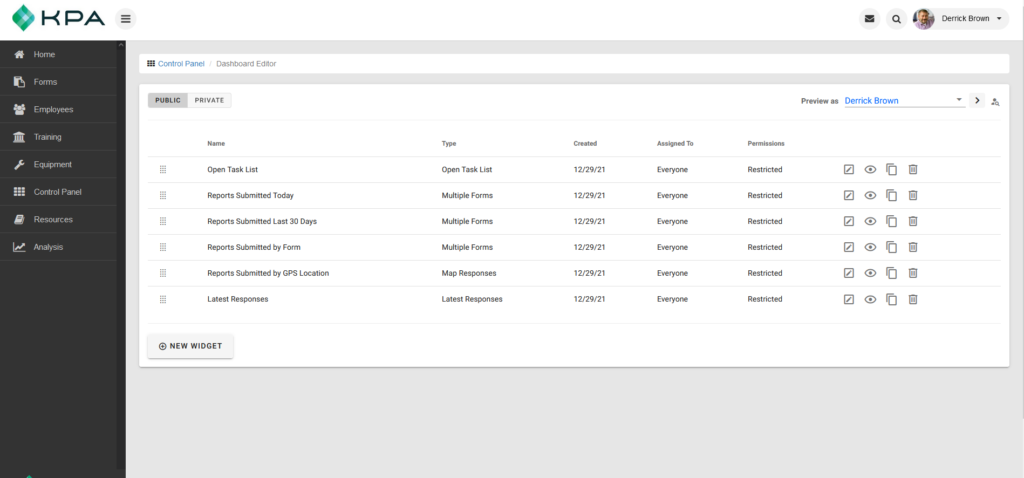
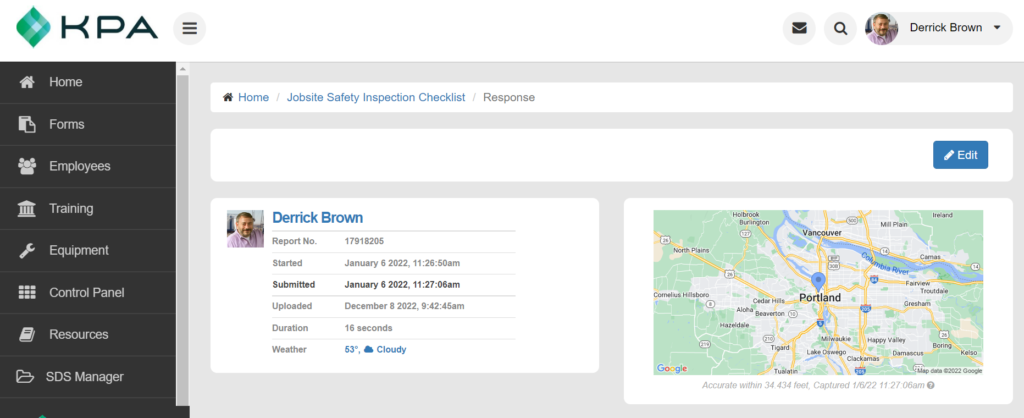
Begin by finding a submitted form response that you wish to adjust the privacy settings for:

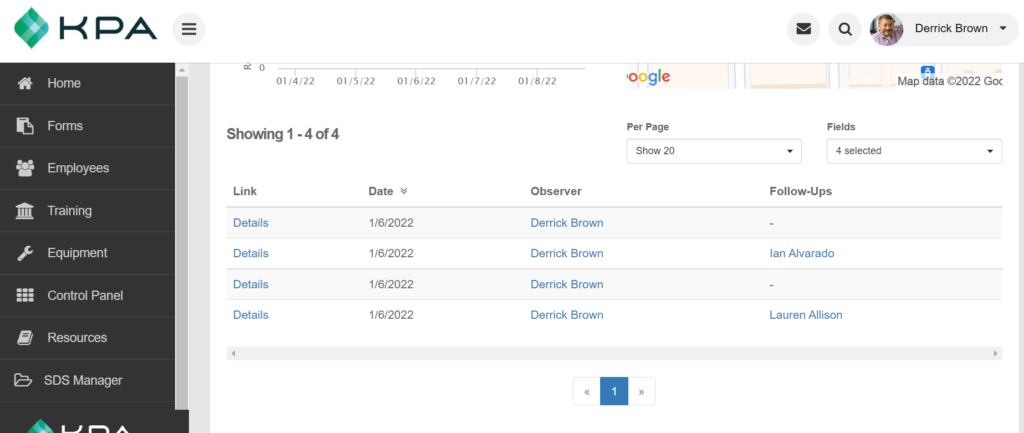
Select the “Details” link to bring up the form response.

Select “Edit”.

Towards the top of the screen, you will see a section titled “Privacy Lock”.

Select the “+” symbol next to Privacy Lock, and a list of users will appear. Select the user or users you wish to lock the form response to.

Scroll to the bottom of the form, and select “Submit.”
This form response will now only be viewable by the user(s) you selected.

Here is a video that will walk you through how to enable the Privacy Lock:

Build a Workflow (Video)

Use the workflow tool to implement your unique business processes using KPA EHS forms, notifications, and tasks.

Add a new workflow

  • Navigate to the Control Panel > FORMS > click on WORKFLOW LIST > click ADD A WORKFLOW.
  • Workflow Name – Give your workflow a name. This is the title of the workflow that will be used in reports and to manage the workflow.
    For example, Incident Report or Management of Change could be titles of a workflow.
  • Workflow Activation – Choose the form that will activate the workflow.
  • Workflow Conditions – Conditions can be enabled that only activate the workflow when the conditions set are true. Conditions can be based on a specific answer within the form that activates the workflow or be based unique classifications of the Observer that is completing the form.
  • Workflow Advanced Settings (Notifications) – Advanced Settings allow users to establish who should be notified when certain activities occur.
    For instance, who to notify when the workflow has started, when the workflow has been completed or when the workflow has stopped mid-process.
    • If the notification needs to be sent to a user who is not relational to the Original Observer the notification can be added by clicking NOTIFICATION GROUPS.
  • Workflow Advanced Settings (Wordsmith Terms) – The terms “Complete” and “Stop” are used by default to identify when a workflow is done and when a workflow has been stopped mid-process. To use different terms, enter them below.

WORKFLOW STEPS

  • Add a Step – In order for a new workflow to be saved one or more steps must be added. Steps represent the actions that must be taken after the form is completed that initiates the workflow.
    • ADD A STEP – to add the first step to the workflow click ADD A STEP.
    • STEP NAME – this is the title of the step and may represent the action being taken or person(s)/role(s) responsible for the step. (e.g., EHS Review)
    • STEP DEADLINE (optional) – this allows for a deadline or due date to be established for this step. The due date will be X days following when the step was assigned which is initiated after form completion.
  • Step Actions – Steps can have one or multiple actions. Step Actions can be done simultaneously whereas Steps must be done sequentially.
    • ADD ACTION – When adding a step action you must first specify what the action is that needs to be completed.
      • Action Title – Give the action a title that represents either the action being completed or person(s)/role(s) responsible for the action.
      • Directions – Provide directions or a description of the action to be taken which will appear for the user that is assigned the action.
      • Complete Task or Submit Form – The action assigned can either be to complete a task (includes adding a signature, adding notes, or adding attachments) or submitting a form (which would require the responsible party to submit an additional form following the initial form completion.
      • Special Actions – Special actions can be provided for task completion including the ability to allow users to Reassign the task to another user or to allow the user to Stop the workflow which would prevent subsequent steps from taking place.
    • IDENTIFY RESPONSIBLE PARTY – Each step action requires a Responsible Party to be identified whom will be assigned the task.
      • If the responsible party is someone related to the original observer (e.g. Supervisor, Manager, HSE, etc.) choose the individual from the drop down menu within the Identify Responsible Party page.
      • If the responsible party is someone not related to the original observer you can identify that user’s classification by adding a CONDITION or specific EMPLOYEE. (e.g., Employee’s Job Title is X).
      • ANY vs ALL – If you have multiple responsible party’s identify you can specify whether ‘ANY’ of them need to complete the action or whether ‘ALL’ of them need to complete the action. (e.g., ALL responsible parties listed need to completed the action).
    • SET VISIBILITY – Identify which Step Actions done previously should be visible to the Responsible Party.
    • NOTIFICATIONS – Indicate who should be notified when activity takes place for the specific step action.

Uploading your own SDS (Video)

KPA provides an extensive database of over 70 million SDSs that keep all of your SDSs updated and accessible 24/7. It is possible that we might not have access to every single SDS that you need for your business, which is why you also have the ability to add your own SDS.

Please note that if you add your own SDS, you will NOT receive the automatic updates, and you will be responsible for updating that sheet when new information becomes available from the manufacturer.

Search the SDS Online Library

KPA has a built-in search capability that allows you to search and save individual SDSs from over 70 Million entries

To get started, go the SDS Manager page and select “Search Online Library”.

Start typing in the Product Search field to auto-populate search results. Once you have results, you can filter even further by searching on a specific language, or vendor.
Individual SDS forms can be previewed or imported.

Once you select “Import”, you will be asked to choose which locations should be associated with the SDS. You must choose at least once location, but if specific products are only found on certain locations, you have the ability to import the SDS to just those locations.

Select “Finish Import”.

Editing SDS

Now that you’ve imported your SDS, you have the ability to customize it to fit your needs. To get started, select an SDS from the SDS Manager.

Product Info

Product info can be found at the top of the page, which includes product name, CAS number, vendor, issue date and language, and You can also download a PDF of the SDS from here.

GHS Labels

If a GHS label is available in the database, you can print it from here. You can also edit or create your own. Every field is fully customizable, allowing you to add any relevant information, or change the hazard pictograms, to fit your needs.

You can also print a label from here.

SDS Details

Alias

You can choose to add an Alias for the product. Perhaps at your facility, this product has another name, such as “Green Goo”.

Notes

You can enter any notes about how the product is used, where it can be found at your facility, or anything at all you might want to add for future reference.

Tags

You can choose to tag this product with any customizable tags. Common tags might include “Hazardous”, “Flammable”, or categories such as “Cleaning supplies”, or “Paint”.

Locations and History

The last thing is to make sure your locations are correct. If you want to add or remove this SDS from any of your locations, you can do so here.

You can also see the history of where and when the SDS was activated or deactivated.

Activate Your Custom Dashboard

Site settings

To activate your custom dashboard you will need to navigate to CONTROL PANEL > under the HOME SETTINGS > Check the box that says SHOW CUSTOM DASHBOARDS.

Keep in mind that checking this box will activate the new dashboard for all users. Be sure to have some widgets available that any type of user can see otherwise their dashboard may be empty.

Customize Your Dashboard

Dashboard Editor

Within the Control Panel>Administration click EDIT DASHBOARD to begin customizing your dashboard display.

The EDIT DASHBOARD page will only be available to those users whom have been granted permission to edit the dashboard from the Roles and Permissions.

Sample widgets will be available which you can edit or remove.

From the Dashboard Editor you can perform the following actions.

  • Toggle between viewing Public and Private widgets.
    • Public widgets are able to be viewed by more than one user
    • Private widgets are only able to be viewed by the user that created it and set the viewing permissions to ONLY ME
  • Preview the Dashboard as yourself or as another user
  • Reorder widgets by dragging them from the left corner
  • Edit a widget
  • Preview a widget
  • Clone a widget to make a copy of it
  • Delete a widget
  • Add a new widget

Add a new widget

To add a new widget to the dashboard click NEW WIDGET at the bottom of the widget list.

Adding a new widget will require you to choose a Widget Title that will appear on the top of the widget as well as an Internal Name.

Widgets can be standard or full width which represents the amount of space a widget takes on the dashboard display.

Widget Permissions

For each widget you will need to determine which users are able to view the widget on their Dashboard.

Setting a LIMITED permission for a widget will allow you to specify the types of users that should see the widget which could be limited based on role, location, position, etc.

Data Permissions can also be RESTRICTED or UNRESTRICTED. Unrestricted permissions means that the widget may display data that was previously restricted through the employee’s role.
Choose “Restricted” if you wish to limit data according to the employee’s role.

Widget Data Sources

To begin building a widget you will need to select the source of data you wish to include in your widget display.

Multiple options of different data sources are available to choose from.

  • OPEN TASK LIST – Shows each user their own listing of open tasks.
  • MULTIPLE FORMS – Look at charts and graphs of data across all your different forms. Filter and segment by date, observer, and more.
  • MAP RESPONSES – Map the GPS positions of the latest form responses filtered by date, observer, form, and more
  • RECENT FOLLOW UPS – List out the latest follow-ups filtered by status, date, form, and assignee.
  • TRAINING COMPLETIONS – Build charts and graphs from training completions organized by topic, location, status, and more.
  • FORM RESPONSES – Use data from a specific form to create charts and graphs. Filter and segment by any field in your form.
  • LATEST RESPONSES – See the latest form responses filtered by form, observer, and date.
  • FOLLOW-UPS STATUS – Create charts and graphs of follow-ups by status, creation date, location, and more.
  • TRAINING STATUS – Build charts and graphs from training status organized by topic, location, status, and more.

Segments

Segments within a widget allow you to separate data by different data elements in order to do comparisons.

An example of data segmentation is included below where we wanted to segment our near miss reports by month and also by year so we can view Year over Year comparisons.

Segmenting by business unit or location is another example where we are able to compare the Risk Assessments for each business unit.

Data

Selecting the data we would like to display within a widget allows you to identify the unit type and format you prefer the count of data to appear in.

When building a widget for training related data you have additional options to separate your training data counts by training status.

Advanced Settings:

Changing the decimals will show that number of decimals on the widget.

The info bubble will show the available options to type into the Label or Description to change items shown on the widget.

  • [TITLE] The title for this item
  • [VALUE] The quantity for this item
  • [CATEGORY] The category for this item
  • [DESCRIPTION] The item description
  • [PERC] The percentage of total
  • [TOTAL] The total (by adding all values)

The Label shows in bold text. In the example shown below, the Category is shown as “OKC” and the Title is shown as “# Complete”. The Description shows in regular text. In the example shown below, the Percent is shown as “45%” and the Value of Total is shown as “85 of 191”.

Chart Types

A chart type can be selected which allows you to identify the display format of the widget data.

Pie Chart – Pie charts can be displayed in either a filled pie or donut style.

Line Chart – Line charts display trends over time.

Big Number – Big number charts display a total count of a selected data set.

Bar Chart – Bar charts can be stacked or side by side to show data comparisons.

Data Table – A data table displays a grid view of information.

Integrating API with Business Intelligence Tools

Many companies wish to integrate KPA Flex data into their own dashboards or BI tools. KPA Flex makes this possible through the KPA Flex API.

https://api.kpaehs.com

The API contains documentation on getting connected, making a request, available endpoints, code samples, a sandbox, and more.

Using the KPA Flex API, your company can pull JSON or CSV data on-demand and load it into your system.

NOTE: KPA Flex does not allow direct connections to database servers. The only method for accessing data is via the API. The API is available free of charge for all clients.

Types of Data

Form responses, employee profiles, assets, inspections, training completions, follow-ups, and more can be loaded from the KPA Flex API.

See a full list at: https://api.kpaehs.com/docs/methods

Form Responses

Form responses are the #1 data type used on the KPA Flex API. There are two ways to access form response data.

responses.flat – this is the easiest method of pulling form responses. This endpoint will provide you a CSV where each row represents a form response. Foreign key data is pre-fetched making it very easy to hit the ground running. For example, instead of providing you an “observer_id”, this endpoint will provide the column “Observer” which contains the observer’s first and last name.

responses.list – this is the more complex method of pulling form responses, but it provides every detail you could possibly want. This data will be full of foreign keys that point to other data in the API. For example, “observer_id” will tell you the id of who filled out the report. To find that person’s name, you’ll need to use the “users.list” endpoint & fetch the profile information. You’ll also need to pull in the “form” data structure in order to interpret this data.

BI INTEGRATION

KPA Flex does not provide specific instructions for integrating with every possible BI tool, but here is a simple example:

Integrating KPA Flex Reports With Google Sheets

OTHER OPTIONS

Keep in mind – the KPA Flex web interface allows you to export all kinds of data as a PDF or Excel spreadsheet. Data types include form responses, asset inspections, training reports, and more. Filter the data you wish to see, choose which columns, and even schedule reports to automatically email daily. For some groups, this may be the easiest way to pull data and create your own reports, graphs, etc.

Integrating API with Google Sheets

Companies often wish to import KPA Flex data into their own dashboards or databases. This is made possible through the KPA Flex API.

In this example, we’ll share how to automatically sync KPA Flex data into a Google Sheets document.

STEP 1) GET A TOKEN

  • Login to your KPA Flex account
  • Go to Control Panel > API 
  • Generate an API token (it will look like kpaehs_live_2347324)
  • That token lets you download your data through the KPA Flex API (so keep it private)

STEP 2) WHICH FORM DO YOU WANT?

  • Now go to your Forms and figure out which form you want
  • Click on “Fill Out” and you’ll see the form id in the url
  • For this example, “Near Miss Report” is form 1234

STEP 3) CREATE THE URL

Now use the token and form id to create a url: (learn more)

https://api.kpaehs.com/v1/responses.flat?%7B%22token%22%3A%22YOURTOKEN%22%2C%22pretty%22%3Atrue%2C%22form_id%22%3AYOURFORMID%2C%22limit%22%3A1000%2C%22format%22%3A%22csv%22%7D

So in this example, we’ll add in our token and form id to get:

https://api.kpaehs.com/v1/responses.flat?%7B%22token%22%3A%22 iscout_live_2347324%22%2C%22pretty%22%3Atrue%2C%22form_id%22%3A1024%2C%22limit%22%3A1000%2C%22format%22%3A%22csv%22%7D

STEP 4) TRY IT

Open that URL in a browser tab. It should download a spreadsheet of your 1000 most recent responses for that form.

STEP 5) ADD IT TO GOOGLE SHEETS

Now create a new Google Sheets document and highlight the top-left cell.

Paste in this formula: 

=importData(“https://api.kpaehs.com/v1/responses.flat?%7B%22token%22%3A%22iscout_live_273642364….%22%2C%22pretty%22%3Atrue%2C%22form_id%22%3A155844%2C%22limit%22%3A1000%2C%22format%22%3A%22csv%22%7D”)

This formula imports the CSV data from your URL. The spreadsheet should now have a bunch of data.

STEP 6) KEEP IT UPDATED

Now you’ve imported data for right now, but what if new form responses come in?

In Google Sheets, go to File > Spreadsheet Settings > Calculation > Recalculation

That setting lets you choose how often the data will refresh.